For about two years, Brandon and I have kept a streak.
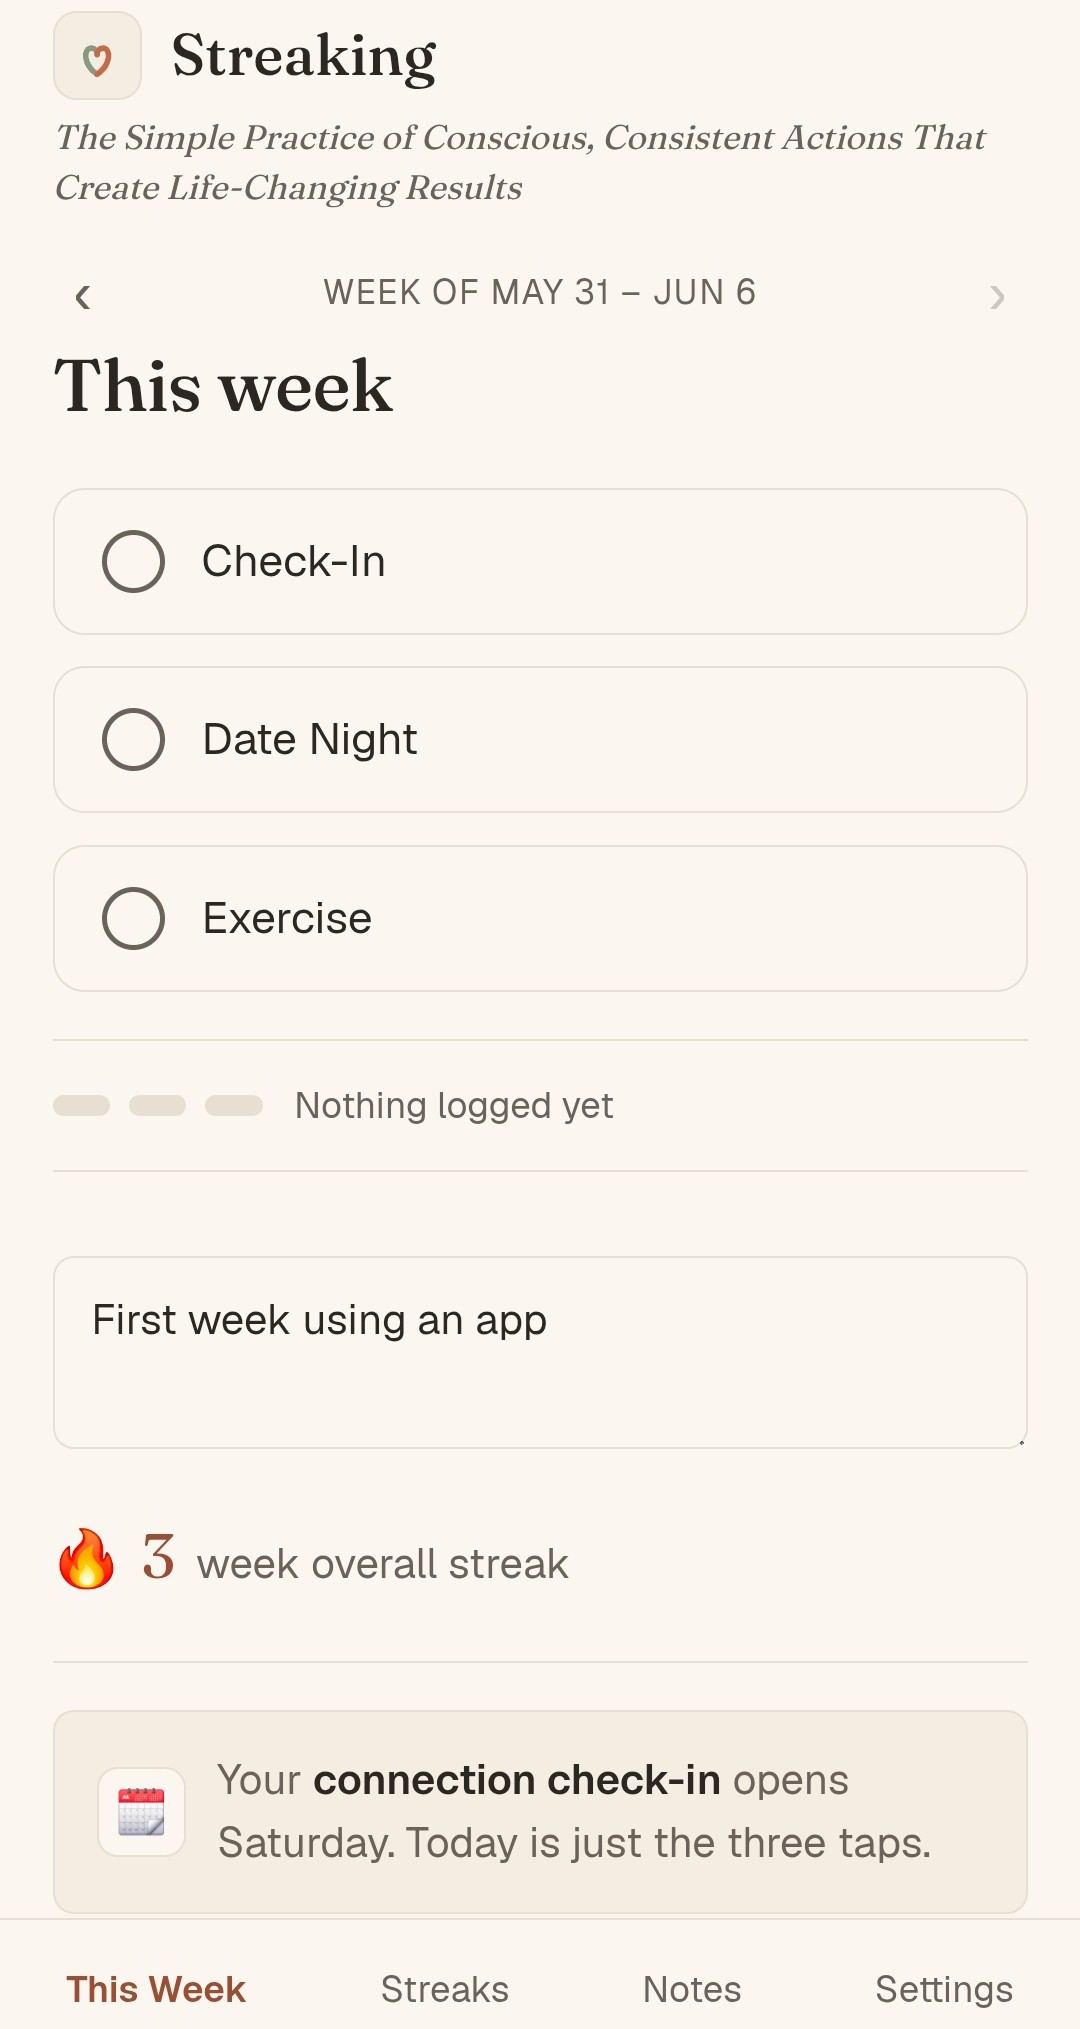
Not a Snapchat streak. A Streaking streak, in the sense of the Jeffery and Jami Downs book — the idea that small, conscious, consistent actions compound into something life-changing. For us that meant three things each week: a relationship check-in, a date night, and exercise. One row per week in a Google Sheet, an x or a 0 in each column, Sunday to Saturday.
The inspiration actually came from my coach, Jim Huling. During a session, Jim shared that he has sent his sweetheart flowers every single week for over 30 years. Think about the sheer logistics of that across a lifetime — moving, career shifts, chaos, and plain old forgetfulness. Yet, every week, the flowers arrived. It wasn't about a grand gesture once a year; it was the unshakeable discipline of showing up weekly to say, "I see you, and you matter." Our spreadsheet was our version of the flowers.
It worked, sort of. The problem was the spreadsheet itself. I'd forget to fill it in, then backfill three weeks from memory on a Sunday night, which is exactly the moment the data stops being honest. The whole point of a streak is that it's real-time. A spreadsheet you update from memory is just a story you tell yourself.
So I decided to build the thing properly. Here's how it went.
I went in assuming I wanted charts. Correlations. A beautiful dashboard showing whether date-night weeks made us happier.
The most useful thing I did was talk myself out of that first.
When I actually traced why the spreadsheet failed, it wasn't a lack of charts — it was friction at the moment of logging, and no nudge. The fix wasn't visualization. It was a one-tap capture screen and a reminder. The dashboard had to earn its place later, once there was data worth looking at. With one rating per person per week, any "correlation" is noise for months anyway.
That reframing — build the capture loop first, let the insights come last — shaped everything. It's also the thing I'd have gotten wrong if I'd just started coding.
This was a fast, intermittent project — mostly run over a weekend, squeezed into the gaps after the baby went to sleep and between other tasks. I used the Garry Tan "gstack" setup to keep things lightweight. The commit history spans about 21 hours total, but the actual building was just a handful of focused hours; the rest was account setup, PR reviews, and sleep.
Before diving into the terminal, I separated the UX design from the core logic. I used Claude Design first to map out the interface, which gave me a much better visual result that I could tweak easily, rather than trying to figure out layout and CSS solely within Claude Code.
Once the design was locked, I tackled the two gnarliest pieces of logic as pure functions, with tests before anything else existed:
Week math. Weeks run Sunday→Saturday in our timezone, which sounds trivial until you think about daylight saving, "is this week locked yet," and "how far back can I edit." All of it lives in one file with one job.
The streak engine. Increment on consecutive kept weeks, reset on a miss, keep the personal best, break on a calendar gap. One function, shared by both the live app and the history import so they can never disagree.
By the time I had a screen, those had ~30 tests passing. Every bug I didn't have for the rest of the build traces back to that hour.
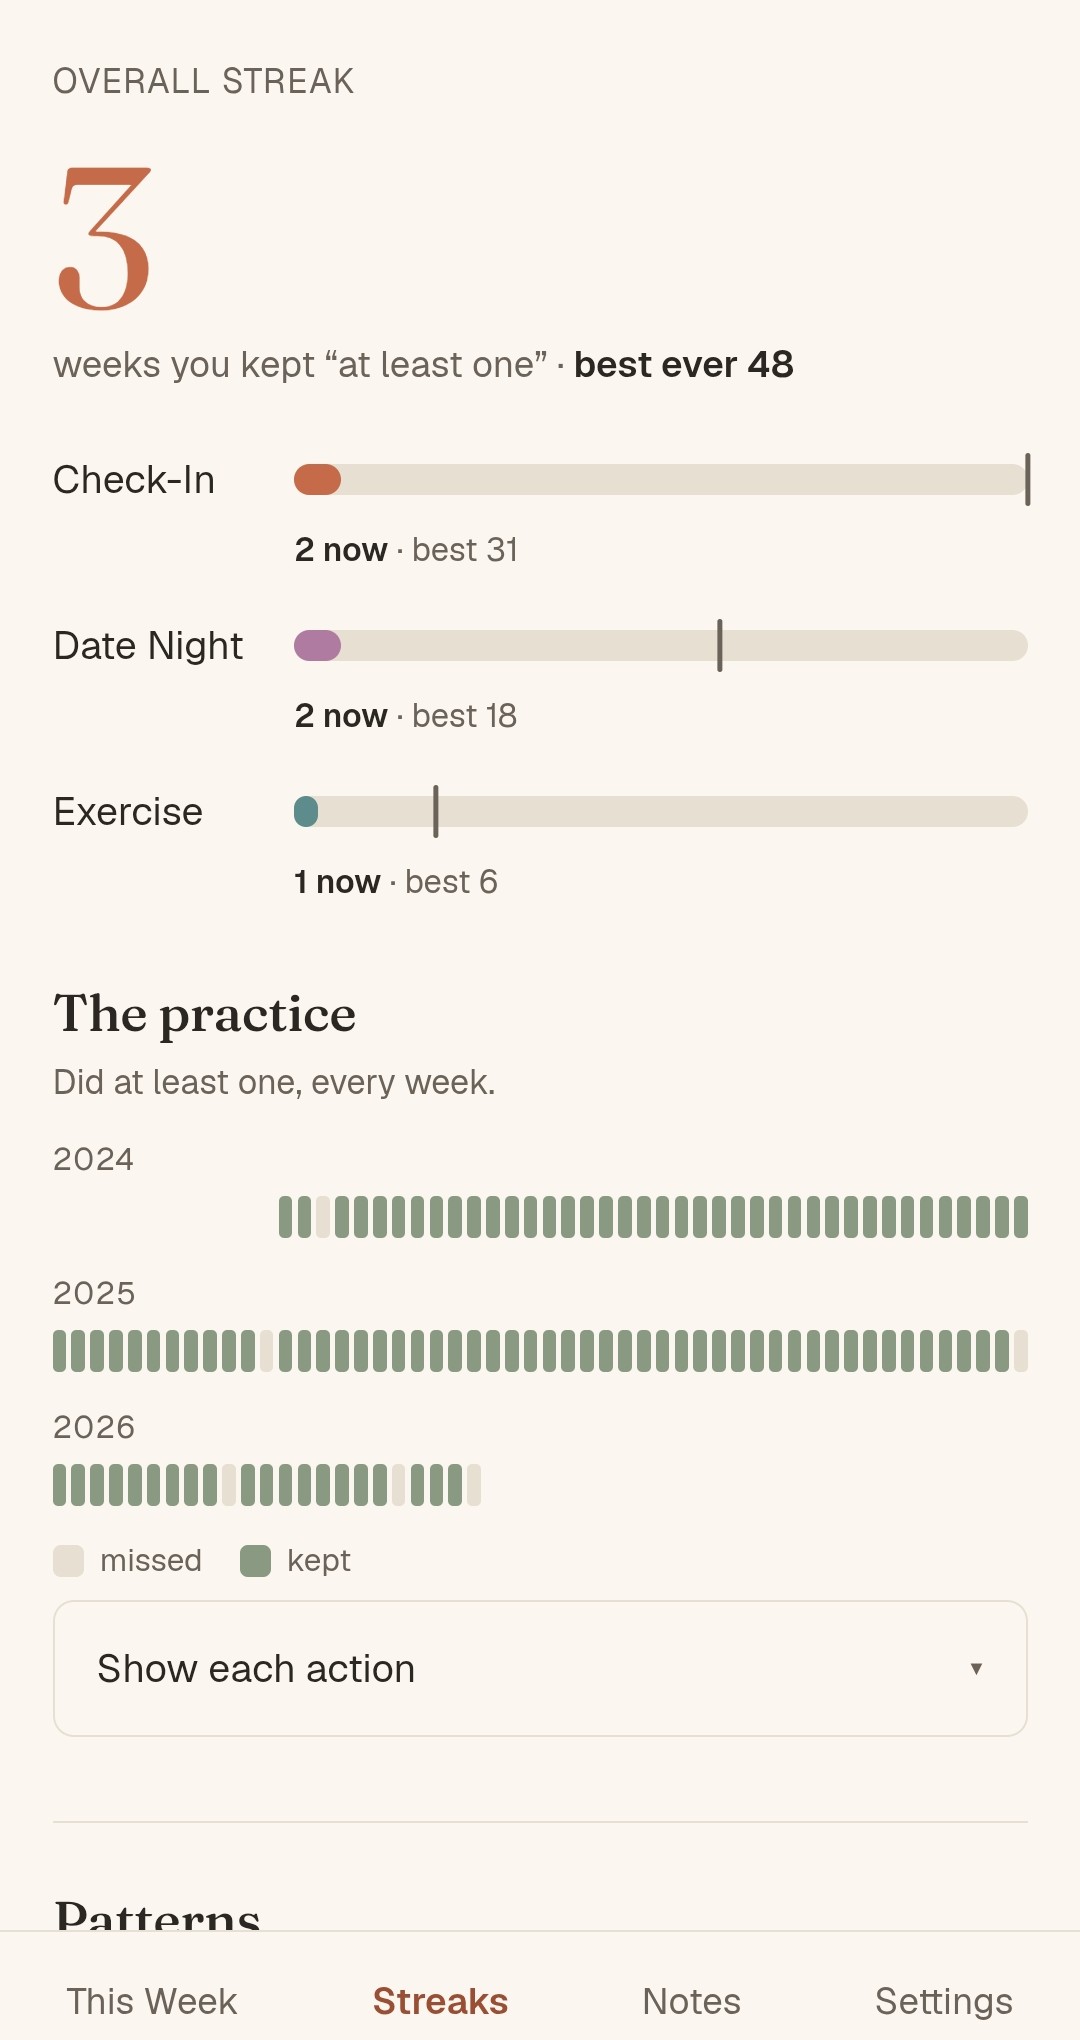
The sheet had 115 weeks in it. Before importing, I wrote a reconciliation pass that checked for gaps, duplicates, non-Sunday dates, and blank-vs-zero cells, and printed a report. It ran clean — and told me something I didn't know: our longest "did at least one" streak was 48 weeks. Almost a year, unbroken.
That changed the emotional frame of the whole app. I wasn't starting a habit from zero. I was protecting a practice we'd already kept for two years — our own 50-year flower streak in the making. The app should feel like that.
(One nice catch from the import check: my sheet ran a week into the future with empty cells. Importing those would've shown a "current streak: 0" on day one, which is exactly the wrong first impression. Trimmed them before committing.)
The new thing I wanted was a weekly question for both of us: how connected do you feel this week, 0–10?
The trick is honesty. If I can see Brandon's number before I answer, I anchor to it. So: we each rate privately, and neither number shows until we've both submitted — then they reveal together. A gap of three or more becomes a gentle "want to talk about it?" rather than a verdict.
This turned out to be the one genuinely tricky bit of engineering. Hiding a partner's number until reveal isn't something row-level security can do on its own (that controls which rows you see, not which columns under a condition). It needed a dedicated database function that only returns the other person's score once both of you are in. Worth getting exactly right — it's the load-bearing wall of trust in the whole app.
I'm on Android and I drive the logging. Brandon's on an iPhone and his one job is to tap a number on Saturday. If that required him to install an app or log in every week, it would never happen.
So his rating arrives as a link in an email, and tapping it drops him straight onto a one-screen 0–10 spectrum, already signed in for that one rating, no password. The honest constraint — he will not do anything that takes more than ten seconds — drove more of the design than any aesthetic preference.
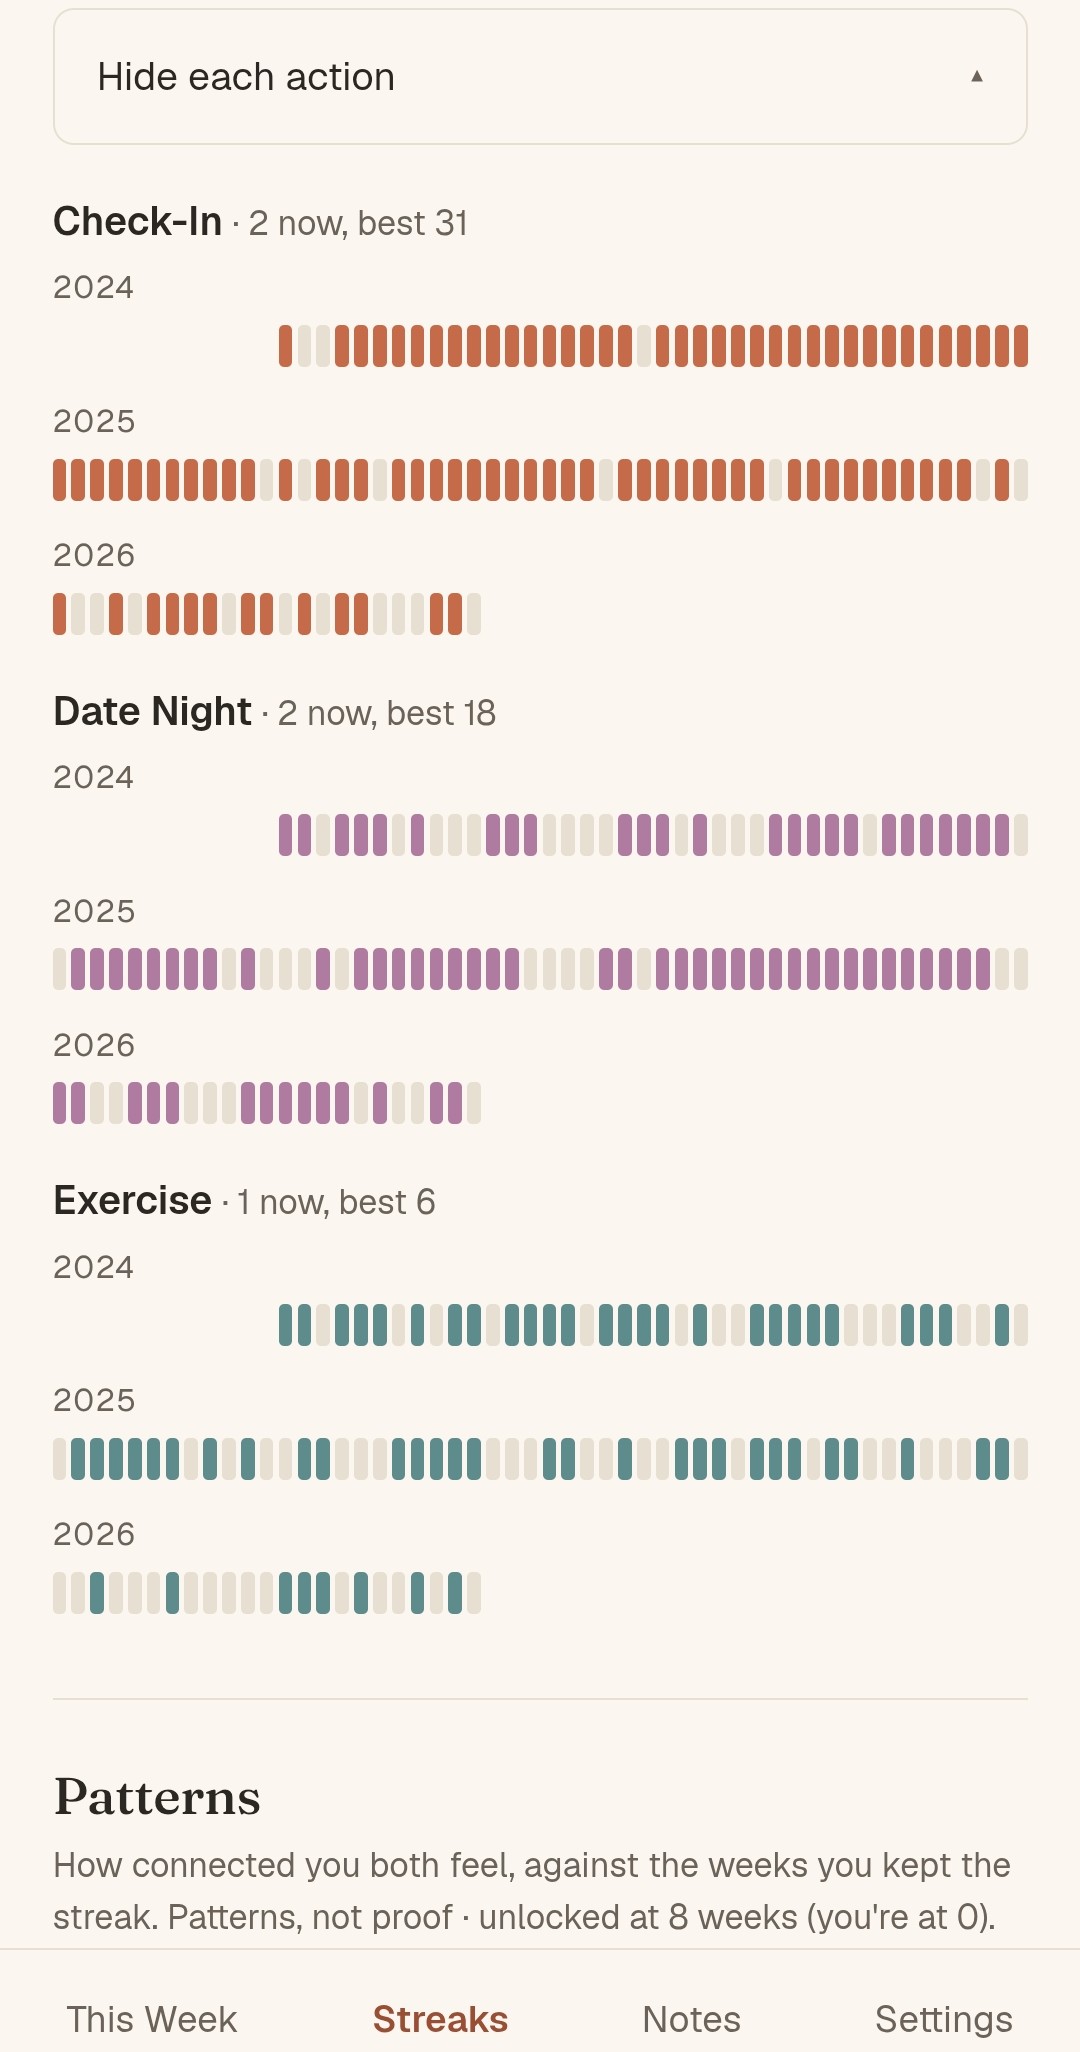
The rest of the app is a calm, papery "shared journal" look: warm cream, a single terracotta accent, a serif for headlines. It's meant to feel like a notebook the two of us keep, not a productivity dashboard. There's a year-grid heatmap of every week we've tracked, mostly filled, with our handful of missed weeks showing as rare gaps. A two-tone heart for a logo.
I built almost all of this with an AI coding agent, and the part that surprised me wasn't the speed — it was where the work moved.
The agent wrote the code. What it couldn't do was decide that the rating should be blind, or that exercising shouldn't count for points (the streak is the motivator, not a score), or that the reminder had to come to Brandon instead of waiting for him to remember. Those are taste calls. The engineering barrier basically evaporated; what was left was knowing what to build and being honest about how two real people would actually use it.
It also caught me being wrong, twice — a streak bar that filled by "best" while labeling itself "now," and a smooth-scroll that fought a layout shift. Good. The last 5% is where software actually lives.
It's live, it's private, it's on both our phones, and it's quietly accumulating honest data. In a couple of months the "Patterns" view unlocks and we'll get to see — gently, patterns-not-proof — whether the weeks we keep our streaks are the weeks we feel most connected. I suspect the data will show our streaks keep us closer. But this time, we'll know for sure, entered the day it happened.
I shared the app with Jim so he could see the ripples of that coaching session. While he got a kick out of the database logic and the custom interface, what he loved most had nothing to do with the code. He loved the story. He loved that we had actively leaned into prioritizing our relationship, intentionally creating and centering a weekly habit around something that truly matters.
Looking at it now, maybe this post belongs less under Tinkerings and more in the Personal section of this site. The engineering barrier has basically evaporated; what's left is knowing what is worth building, and having the discipline to show up for the people you love.
Built with Next.js, Supabase, and a lot of small, conscious, consistent commits.